The purpose of this lab is to gain knowledge and practice evaluating the accuracy of classifications performed on remotely sensed images. Performing accuracy assessments is a mandatory post-processing step to classified images.
Methods
All of the following methods were performed in Erdas Imagine 2015.
Performing accuracy assessment is done in two steps. Generating ground reference test samples is the first step. Utilizing the test samples to perform the accuracy assessment is the second step. I will be performing the accuracy assessment on my unsupervised image first.
Generating Ground Reference Test Samples
Opening the classified image into the first viewer and the reference image in a second viewer is the first step of the process. To open the accuracy assessment window activate the first viewer, select Accuracy Assessment from the Raster tab and Supervised sub-tab. Open the classified image into the accuracy assessment window. Clicking the Select Viewer icon and clicking anywhere in viewer 2 designates the image as the reference for the assessment.
Next, you have to generate random points to assess the accuracy from. Selecting Create/Add Random Points from the Edit menu opens the Add Random Points window. I set the Number of Points to 125, the Distribution Parameters to Stratified Random, the number of minimum points to 15 and selected the 4 classes from my unsupervised classification (Fig. 1). The reference image is now populated with 125 sample points also with the Accuracy Assessment window.
 |
| (Fig. 1) Parameters set and the classes selected to generate the random points. |
 |
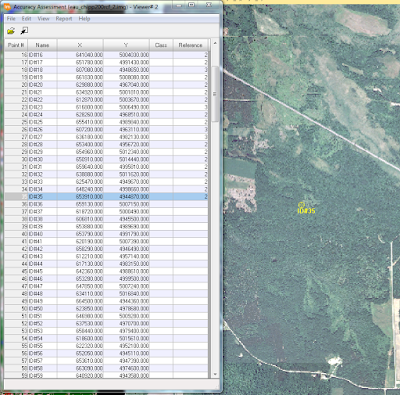
| (Fig. 2) Evaluating the sample point for LULC class and entering in the value in to the Reference column. |
Generating the Accuracy Assessment Report
Select Accuracy Report from the Reports menu to generate the assessment report (Fig. 4).
 |
| (Fig. 4) One page of the accuracy assessment report for the unsupervised classification from Erdas . This report is over 17,000 lines long, and the above image displays on 60 of the lines. |
 |
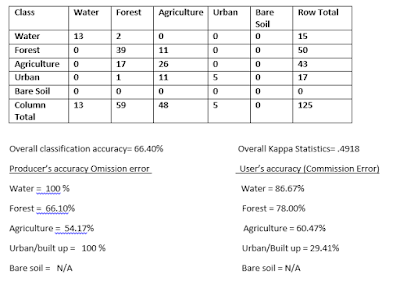
| (Fig. 5) Compiled data from the accuracy assessment report in an Excel/Word document. |
I ran in to a software glitch when performing my accuracy assessment on the supervised classification. The report would run but was not labeled properly and did not produce any Kappa statistics. After consulting with my professor, he determined an error occurred between the algorithm and the newest version of the software. At this time I am unable to produce any results from my supervised classification.
Sources
High resolution image is from United States Department of Agriculture (USDA) National Agriculture Imagery Program.
Landsat satellite image is from Earth Resources Observation and Science Center, United States Geological Survey.

No comments:
Post a Comment