The purpose of this lab develop skills in identifying and removing data redundancy between satellite image bands. I will be extracting and utilizing statistical information to perform analysis to aid me in identifying data redundancy.
Methods
All of the following methods will be performed in Erdas Imagine 2015.
There are multiple methods to determine the quality of an image. During this lab I will be creating "Feature Space Plot" and also performing "Correlation Analysis" to identify data redundancies between two image bands.
Feature Space Plot
Feature space plots display a comparison of data values for two bands of an satellite image. The resulting graphic plot will allow me to determine the bands in a multispectral or hyperspectral image which can be utilized for the most efficient image classification.
I selected the Raster tab, then selected Supervised, and lastly selected Feature Space Image which opened up the create feature space image window. I input the image I desired to run the tool on and created and output file for the results. After running the tool I was able to open all 15 of the feature space plots for the TM image I was given (Fig. 1).
 |
| (Fig. 1) Display of all the feature space plots for a TM satellite image for bands 1,2,3,4,5,7. |
Correlation Analysis
Correlation analysis is another method of analyzing data quality and preventing data redundancies. The method of correlation analysis is the most effective method to determine high correlation between 2 bands withing the satellite image.
To perform correlation analysis I used model builder in Erdas to run the predefined correlation function with the inputs for the images I was instructed to run the analysis on (Fig. 2). The output of this function is a table of values displaying the correlation between all of the band values. If the value between two bands is >.95 it has a high correlation and myself as the analyst have to decide if I am going to keep both of the bands or if I am able to eliminate one of the 2 bands based on the objective of the research being conducted. I ran image correlation for 3 different images (1 TM and 2 Quickbird images) which are displayed in the results section below.
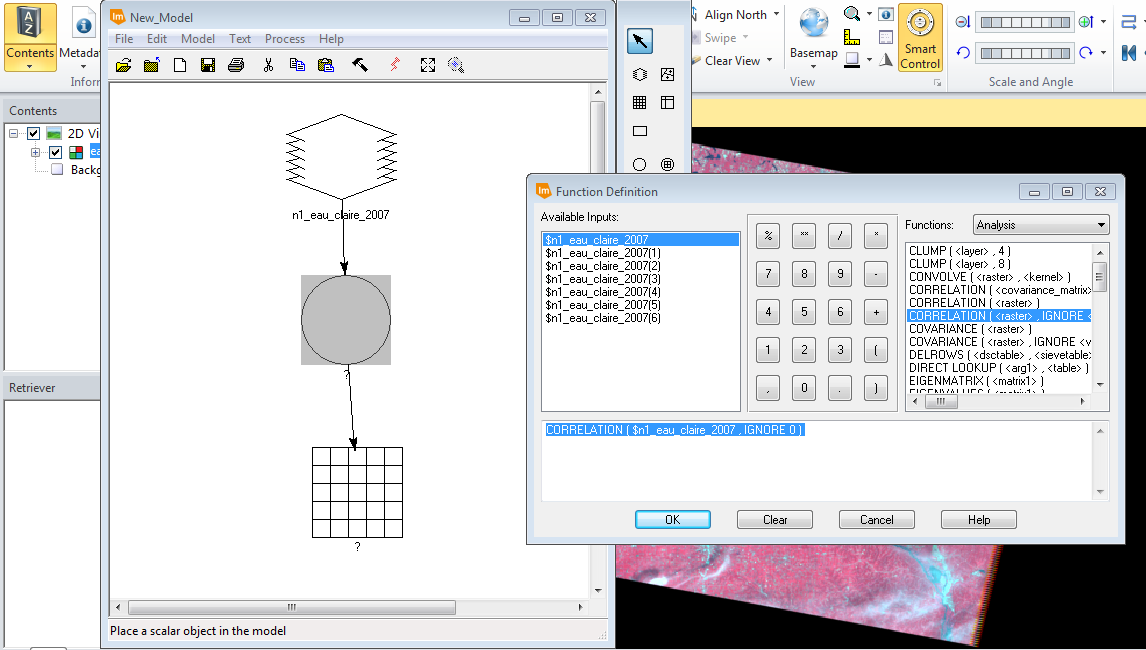 |
| (Fig. 2) Setup using model builder to run image correlation. |
Results
When analyzing feature space plots for correlation analysis I was looking at the distribution of the brightness values. When the feature space plot has a narrow distribution it tells me the 2 bands being compared have a high correlation (Fig. 3) When the feature space plot has a wide distribution it tells me the 2 bands being compared have a low correlation (Fig. 4).
 |
| (Fig. 3) Feature Space Plot displaying high correlation between 2 bands of a satellite image. |
 |
| (Fig. 4) Feature Space Plot displaying low correlation between 2 bands of a satellite image |
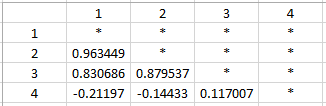
After running correlation analysis for an TM image for the Eau Claire, WI the table displayed a correlation right on the edge of being high between bands 2 and 3 (Fig. 5). Depending on the purpose of the analysis I may choose to eliminate either band to reduce the redundancy of data.
 |
| (Fig. 5) Correlation Analysis for Eau Claire TM image from my lab assignment. |
I ran correlation analysis on the 2 Quickbird images I was given for my lab and found a high correlation between band 1 and 2 for both of the images (Fig. 6 & 7). For the image in the Florida Keys I would choose to eliminate band 2 as there is a over abundance of water in the Florida Keys area which make band 1 (blue) more useful.
 |
| (Fig. 6) Correlation Analysis table for Florida Keys Quickbird image from my lab assignment. |
 |
| (Fig. 7) Correlation Analysis table for Bangladesh Quickbird image from my lab assignment. |
Landsat satellite image is from Earth Resources Observation and Science Center, United States Geological Survey.
Quickbird high resolution images are from Global Land Cover Facility at www.landcover.org
salesforce online courses
ReplyDeletehadoop online courses
Data Science online courses
linux online courses
etl testing online courses
web methods online courses