The main purpose of the lab is to provide me (the student) practical experience correcting atmospheric interference on remotely sensed images. The first objectives of this lab will have me performing atmospheric correction using multiple methods on remotely sensed images. The second objective of the lab will have me performing relative atmospheric correction on remotely sensing images.
Methods
All of the following methods were performed in ERDAS Imagine 2015 unless noted.
Absolute Atmospheric Correction Using Empirical Line Calibration
The first part of the lab I will be conducting Empirical Line Calibration (ELC) to correct atmospheric interference on a Landsat 5 TM image of Eau Claire, WI and the surrounding area. To perform ELC to correct remotely sensed images you need in situ spectral reflectance measurements from the same time the image was collected. The majority of in situ data is not available for older or even present day data. Performing ELC is still possible through the use of spectral libraries to obtain in situ data for some of the surfaces within the image. I do not have any in situ data from the day and time my image was collected so I will be consulting a spectral library to perform my ELC correction. I was provided the ELC equation by my professor (Fig. 1).
 |
| (Fig. 1) Empirical Line Calibration equation. |
 |
| (Fig 2.) Spectral Analysis Work Station with image displayed in false color infrared (4,3,2) |
 |
| (Fig. 3) Atmospheric Adjustment Tool window with Sample and Reference sample selected. |
Once all of the samples have been entered the Spectral Analysis Workstation calculates a regression equation for each of the bands. Once I save the regression information I closed out the Atmospheric Adjustment Tool and run the Atmospheric Adjustment from the Spectral Analysis Workstation window. After the tool completes I opened up the corrected image file to compare the results to the original uncorrected image (Fig. 14).
Absolute Atmospheric Correction Using Enhanced Image Based Dark Object Subtraction
During this section of the lab I conducted a different form of Absolute Atmospheric Correction called Dark Object Subtraction (DOS). The DOS uses a number of parameters including: sensor gain, offsetm solar irradiance, solar zenith angle, atmospheric scattering, absorption, and path radiance to correct for atmospheric interference.
The first step for DOS is to convert the satellite image to at-satellite spectral radiance using a given formula (Fig. 5). All of the values for the formula are found within the metadata of the image.
 |
| (Fig. 5) Formula to convert a satellite image to at-satellite spectral radiance. |
 |
| (Fig. 6) At-satellite spectral radiance conversion model. |
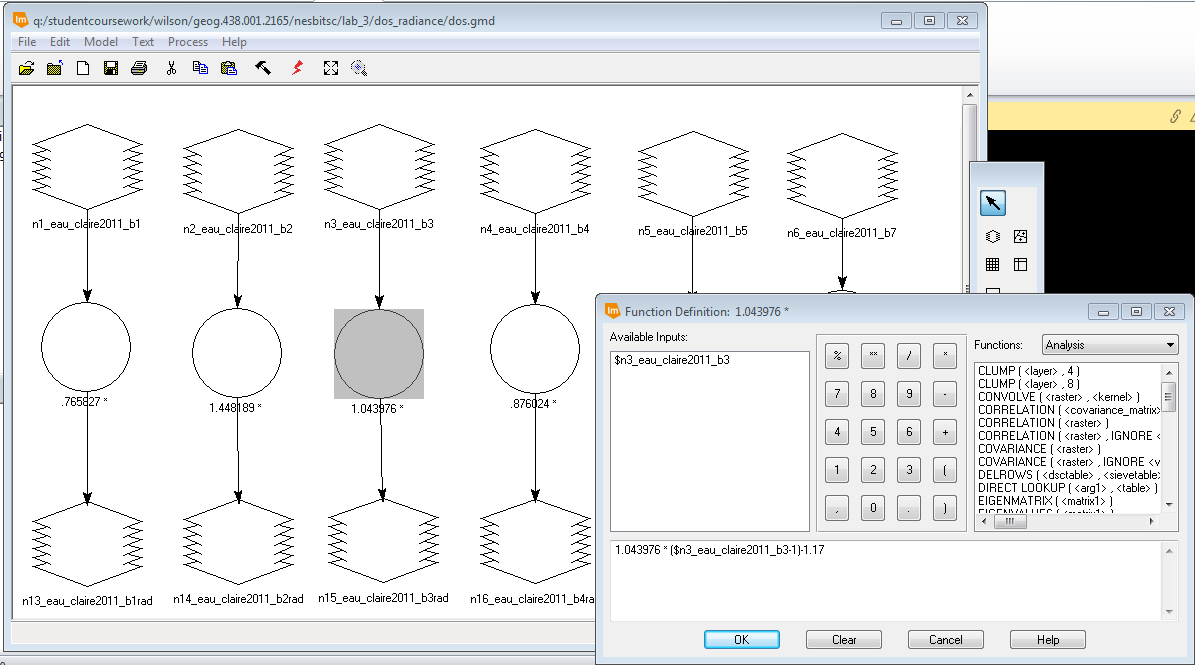
Next, I then had to convert the at-satellite spectral radiance to true surface reflectance using a given formula (Fig. 7). The distance between the Earth and sun value was obtained from a supplied chart from my professor. Path radiance is the distance from the origin of the histogram and the actual beginning of the histogram in the metadata chart found in Erdas. The TAUv value is approximated as 1 because the satellite image was collected at nadir. The Esun value was obtained from a chart provided by my professor. The sun zenith angle is calculated by subtracting the sun elevation angle which is obtained from the metadata from 90. The TAUz value was improvised and approximated from an average value chart. I utilized model maker in Erdas to apply the formula to each image band from step one (Fig. 8).
 |
| (Fig. 7) Formula to convert image from at-satellite spectral radiance to true surface reflectance. |
 |
| (Fig. 8) Conversion from at-satellite spectral radiance to true surface reflectance model. |
With six output images from the previous step I completed a layer stack of the corrected band images to produce and image to compare to the original (Fig. 14).
Relative Atmospheric Correction Using Multidate Image Normalization
This section of the lab will have me performing Relative Atmospheric Correction using Multidate Image Normalization on a 2009 image of Chicago and the surrounding area from a base image collected in 2000. The first step in performing Multidate Image Normalization requires you to collect radiometric ground control points from the base image and the image to be corrected. I collected 15 sample points from both images in matching locations from various surface types using the Spectral Profile tool in Erdas (Fig. 9).
 |
| (Fig. 9) Spectral profile chart results for sample points in both images. |
Then I opened the the Tabular Data from the Spectral Profile window. From this window I collected the Mean Pixel value for each band layer from each spectral sample point. I copied all the values into an Excel spreadsheet (Fig. 10). With in Excel I was able to create a scatter plot containing the values of each band from both the base image the to be corrected. I was able to add a Trendline to with the (regression) Equation and R-squared value on the scatter plot (Fig. 11). After making sure my R-squared value was above .85 I was able to create a model utilizing the regression equation from each band to correct the 2009 image (Fig. 12). After running the model I had to utilize the layer stack feature to create an output image to compare to the original (Fig. 15).
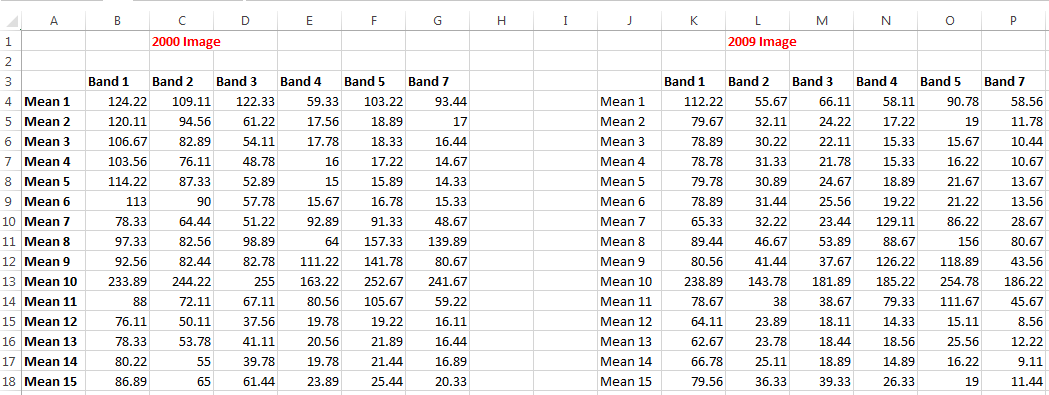 |
| (Fig. 10) Mean pixel values for the spectral sample separated by band in Excel. |
 |
| (Fig. 11) Scatter plots with regression equation and R-squared value created in Excel for each band. |
 |
| (Fig. 12) Model utilizing the regression equation from the scatter plots create in Excel. |
Results
 |
| (Fig 13) Uncorrected Landsat 5 TM image (Left) ELC corrected image (Right). |
 |
| (Fig. 14) Uncorrected Landsat 5 TM image (Left) DOS corrected image (Right) |
 |
| (Fig. 15) Uncorrected Chicago area image (Left) Multidate Image Normalization correction (Right) |
Landsat.usgs.gov,. (2016). Landsat. from http://landsat.usgs.gov/
Thank u it was helpful
ReplyDelete